RECIST 1.1 scoring at first follow-up scan does not stratify overall survival in the PACTO trial
Last updated: 2025-03-27
Checks: 6 1
Knit directory: hruban_wflow/
This reproducible R Markdown analysis was created with workflowr (version 1.7.1). The Checks tab describes the reproducibility checks that were applied when the results were created. The Past versions tab lists the development history.
The R Markdown file has staged changes. To know which version of the
R Markdown file created these results, you’ll want to first commit it to
the Git repo. If you’re still working on the analysis, you can ignore
this warning. When you’re finished, you can run
wflow_publish to commit the R Markdown file and build the
HTML.
Great job! The global environment was empty. Objects defined in the global environment can affect the analysis in your R Markdown file in unknown ways. For reproduciblity it’s best to always run the code in an empty environment.
The command set.seed(20250319) was run prior to running
the code in the R Markdown file. Setting a seed ensures that any results
that rely on randomness, e.g. subsampling or permutations, are
reproducible.
Great job! Recording the operating system, R version, and package versions is critical for reproducibility.
Nice! There were no cached chunks for this analysis, so you can be confident that you successfully produced the results during this run.
Great job! Using relative paths to the files within your workflowr project makes it easier to run your code on other machines.
Great! You are using Git for version control. Tracking code development and connecting the code version to the results is critical for reproducibility.
The results in this page were generated with repository version 6dc79eb. See the Past versions tab to see a history of the changes made to the R Markdown and HTML files.
Note that you need to be careful to ensure that all relevant files for
the analysis have been committed to Git prior to generating the results
(you can use wflow_publish or
wflow_git_commit). workflowr only checks the R Markdown
file, but you know if there are other scripts or data files that it
depends on. Below is the status of the Git repository when the results
were generated:
Ignored files:
    Ignored:    .DS_Store
    Ignored:    code/rlucas/.DS_Store

Untracked files:
    Untracked:  README.Rmd
    Untracked:  code/pivot_wider_pacto.R
    Untracked:  data/120122_mutations.csv
    Untracked:  data/CA199.csv
    Untracked:  data/CP_PAC_artemis.xlsx
    Untracked:  data/CheckPAC_clinical_annotated011622.xlsx
    Untracked:  data/Checkpac_Test.csv
    Untracked:  data/Expected.csv
    Untracked:  data/ID_comparison.xlsx
    Untracked:  data/Locked_Models/
    Untracked:  data/PACTO Masterfile.xlsx
    Untracked:  data/PACTO_BL_EOT_EOS_PFS_TA_jh.xlsx
    Untracked:  data/Test_set_pacto.csv
    Untracked:  data/allfeatures_pacto.5mb.hg19.csv
    Untracked:  data/artemis.csv
    Untracked:  data/barv1.csv
    Untracked:  data/cellularity.csv
    Untracked:  data/checkpac_5mb_bins/
    Untracked:  data/checkpac_baseline_p2_dates.csv
    Untracked:  data/checkpac_bins.csv
    Untracked:  data/checkpac_ca199.csv
    Untracked:  data/checkpac_ca199_baseline_p4_dates.csv
    Untracked:  data/checkpac_features.csv
    Untracked:  data/checkpac_plasma_manifest.xlsx
    Untracked:  data/clinical_073123.xlsx
    Untracked:  data/combined_bins_102324.rds
    Untracked:  data/df_results_CAIRO5_2_6_ checkpac_ pacto.tsv
    Untracked:  data/estimates/
    Untracked:  data/fig2c_p2_data.rds
    Untracked:  data/for_leal_plot_042324.xlsx
    Untracked:  data/fp2_lucas_healthy.csv
    Untracked:  data/i07_input.xlsx
    Untracked:  data/loadings.rds
    Untracked:  data/long_bins.csv
    Untracked:  data/pacto_5mb_bins/
    Untracked:  data/pacto_bins.csv
    Untracked:  data/pacto_features.csv
    Untracked:  data/sel_chr.txt
    Untracked:  data/supplementary_tables.xlsx
    Untracked:  data/tumor_tmb.txt
    Untracked:  extdata/
    Untracked:  output/process_tcga_beta.Rmd/

Unstaged changes:
    Modified:   .gitignore
    Modified:   README.md

Staged changes:
    Modified:   analysis/about.Rmd
    New:        analysis/ext-fig1.Rmd
    New:        analysis/ext-fig10.Rmd
    New:        analysis/ext-fig11.Rmd
    New:        analysis/ext-fig12.Rmd
    New:        analysis/ext-fig13.Rmd
    New:        analysis/ext-fig14.Rmd
    New:        analysis/ext-fig15.Rmd
    New:        analysis/ext-fig16a.Rmd
    New:        analysis/ext-fig16b.Rmd
    New:        analysis/ext-fig17.Rmd
    New:        analysis/ext-fig18.Rmd
    New:        analysis/ext-fig19.Rmd
    New:        analysis/ext-fig20.Rmd
    New:        analysis/ext-fig21a.Rmd
    New:        analysis/ext-fig21b.Rmd
    New:        analysis/ext-fig22a.Rmd
    New:        analysis/ext-fig22b.Rmd
    New:        analysis/ext-fig23a.Rmd
    New:        analysis/ext-fig23b.Rmd
    New:        analysis/ext-fig24.Rmd
    New:        analysis/ext-fig2a.Rmd
    New:        analysis/ext-fig2b.Rmd
    New:        analysis/ext-fig3.Rmd
    New:        analysis/ext-fig4.Rmd
    New:        analysis/ext-fig5.Rmd
    New:        analysis/ext-fig6.Rmd
    New:        analysis/ext-fig7.Rmd
    New:        analysis/ext-fig8.Rmd
    New:        analysis/ext-fig9.Rmd
    New:        analysis/fig1a.Rmd
    New:        analysis/fig1b.Rmd
    New:        analysis/fig2a.Rmd
    New:        analysis/fig2b.Rmd
    New:        analysis/fig2c.Rmd
    New:        analysis/fig3a.Rmd
    New:        analysis/fig3b.Rmd
    New:        analysis/fig4.Rmd
    New:        analysis/fig5.Rmd
    New:        analysis/fig6a.Rmd
    New:        analysis/fig6b.Rmd
    New:        analysis/fig6c.Rmd
    New:        analysis/fig7a.Rmd
    New:        analysis/fig7b.Rmd
    New:        analysis/fig8.Rmd
    New:        analysis/fig9a.Rmd
    New:        analysis/fig9b.Rmd
    Modified:   analysis/index.Rmd
    Modified:   analysis/license.Rmd
    New:        code/functions.R
    New:        code/hr_plot_funcs.R
    New:        code/liver.tools/DESCRIPTION
    New:        code/liver.tools/NAMESPACE
    New:        code/liver.tools/R/functions.R
    New:        code/liver.tools/R/help.R
    New:        code/liver.tools/man/liver.tools.Rd
    New:        code/liver.tools/zzz.R
    New:        code/process_ab.Rmd
    New:        code/process_tcga_beta.Rmd
    New:        code/rlucas/DESCRIPTION
    New:        code/rlucas/NAMESPACE
    New:        code/rlucas/R/functions.R
    New:        code/rlucas/R/help.R
    New:        code/rlucas/data-derived/SummarizedExperiment.R
    New:        code/rlucas/data/lucas_5mb.rda
    New:        code/rlucas/data/metadata.rda
    New:        code/rlucas/data/prediction_lucas.rda
    New:        code/rlucas/data/se.rda
    New:        code/rlucas/data/valid_metadata.rda
    New:        code/rlucas/inst/extdata/survival_analysis_samples.xlsx
    New:        code/rlucas/man/rlucas.Rd
    New:        code/useful.stuff.aa/DESCRIPTION
    New:        code/useful.stuff.aa/NAMESPACE
    New:        code/useful.stuff.aa/R/convenience.R
    New:        code/useful.stuff.aa/R/models.R
    New:        code/useful.stuff.aa/data/liver_meta.rda
    New:        code/useful.stuff.aa/data/lucas_meta.rda
    New:        code/utility_funcs.R
Note that any generated files, e.g. HTML, png, CSS, etc., are not included in this status report because it is ok for generated content to have uncommitted changes.
There are no past versions. Publish this analysis with
wflow_publish() to start tracking its development.
RECIST 1.1 scoring at first follow-up scan does not stratify overall survival in the PACTO trial. Overall survival probability is shown for each of the response categories for RECIST 1.1 score at the first follow-up at 8-weeks on the left, and for best overall response by RECIST 1.1 on the right.
library(ggpubr)
library(here)
library(readxl)
library(survival)
library(survminer)
library(tidyverse)
clean_data <- read_excel(here("data/supplementary_tables.xlsx"),
sheet = "Table S4", range = "A2:S42")
delfi_pred <- read_excel(here("data/supplementary_tables.xlsx"),
sheet = "Table S5", range = "A2:N207")clean_data <- clean_data %>%
filter(`RECIST at FU 1` != "Not Evaluable")
delfi_pred <- delfi_pred %>%
filter(Timepoint == "Endpoint")
DELFI_complete <- delfi_pred %>%
inner_join(clean_data, by = "Patient") %>%
mutate(across("Deceased", str_replace, "Yes", "1"),
across("Deceased", str_replace, "No", "0")) %>%
mutate(`OS (days)` = as.numeric(`OS (days)`),
`PFS (days)` = as.numeric(`PFS (days)`),
`Deceased` = as.numeric(Deceased),
`FU1` = as.character(`RECIST at FU 1`),
`BOR` = as.character(`BOR RECIST 1.1`))Warning: There was 1 warning in `mutate()`.
ℹ In argument: `across("Deceased", str_replace, "Yes", "1")`.
Caused by warning:
! The `...` argument of `across()` is deprecated as of dplyr 1.1.0.
Supply arguments directly to `.fns` through an anonymous function instead.
# Previously
across(a:b, mean, na.rm = TRUE)
# Now
across(a:b, \(x) mean(x, na.rm = TRUE))p <- vector("list", 2)
fit <- survfit(Surv(`OS (days)`, Deceased) ~ FU1, data = DELFI_complete)
p[[1]] <- fit %>%
ggsurvplot(pval = TRUE, risk.table = TRUE, risk.table.col = "strata",
surv.median.line = "hv",
#title = "Overall survival based on RECIST Follow up",
ylab = "Overall survival probability",
xlab = "Time in Days",
ggtheme = theme_classic2(base_size = 11),
legend = c(.9, .75),
legend.title = element_blank(),
legend.labs = c("PR", "PD", "SD"),
pval.size = 3, pval.coord = c(400, .25))Warning in geom_segment(aes(x = 0, y = max(y2), xend = max(x1), yend = max(y2)), : All aesthetics have length 1, but the data has 3 rows.
ℹ Please consider using `annotate()` or provide this layer with data containing
a single row.p[[1]]$plot <- p[[1]]$plot +
annotate("text", x = 800, y = 0.95,
label = "RECIST 1.1 assessment\n(8 weeks)",
size = 3, hjust = 0)
fit <- survfit(Surv(`OS (days)`, Deceased) ~ BOR, data = DELFI_complete)
p[[2]] <- fit %>%
ggsurvplot(pval = TRUE, risk.table = TRUE, risk.table.col = "strata",
surv.median.line = "hv",
#title = "Overall survival based on BOR",
xlab = "Time in Days",
ylab = "Overall survival probability",
ggtheme = theme_classic2(base_size = 11),
legend = c(.9, .75),
legend.title = element_blank(),
legend.labs = c("PR", "PD", "SD"),
pval.size = 3, pval.coord = c(750, .25))Warning in geom_segment(aes(x = 0, y = max(y2), xend = max(x1), yend = max(y2)), : All aesthetics have length 1, but the data has 3 rows.
ℹ Please consider using `annotate()` or provide this layer with data containing
a single row.p[[2]]$plot <- p[[2]]$plot +
annotate("text", x = 800, y = 0.95,
label = "Best overall response\nRECIST 1.1 assessment",
size = 3, hjust = 0)
arrange_ggsurvplots(p, nrow = 1)Warning in geom_segment(aes(x = 0, y = max(y2), xend = max(x1), yend = max(y2)), : All aesthetics have length 1, but the data has 3 rows.
ℹ Please consider using `annotate()` or provide this layer with data containing
a single row.Warning in geom_segment(aes(x = 0, y = max(y2), xend = max(x1), yend = max(y2)), : All aesthetics have length 1, but the data has 3 rows.
ℹ Please consider using `annotate()` or provide this layer with data containing
a single row.
All aesthetics have length 1, but the data has 3 rows.
ℹ Please consider using `annotate()` or provide this layer with data containing
a single row.
All aesthetics have length 1, but the data has 3 rows.
ℹ Please consider using `annotate()` or provide this layer with data containing
a single row.
All aesthetics have length 1, but the data has 3 rows.
ℹ Please consider using `annotate()` or provide this layer with data containing
a single row.
All aesthetics have length 1, but the data has 3 rows.
ℹ Please consider using `annotate()` or provide this layer with data containing
a single row.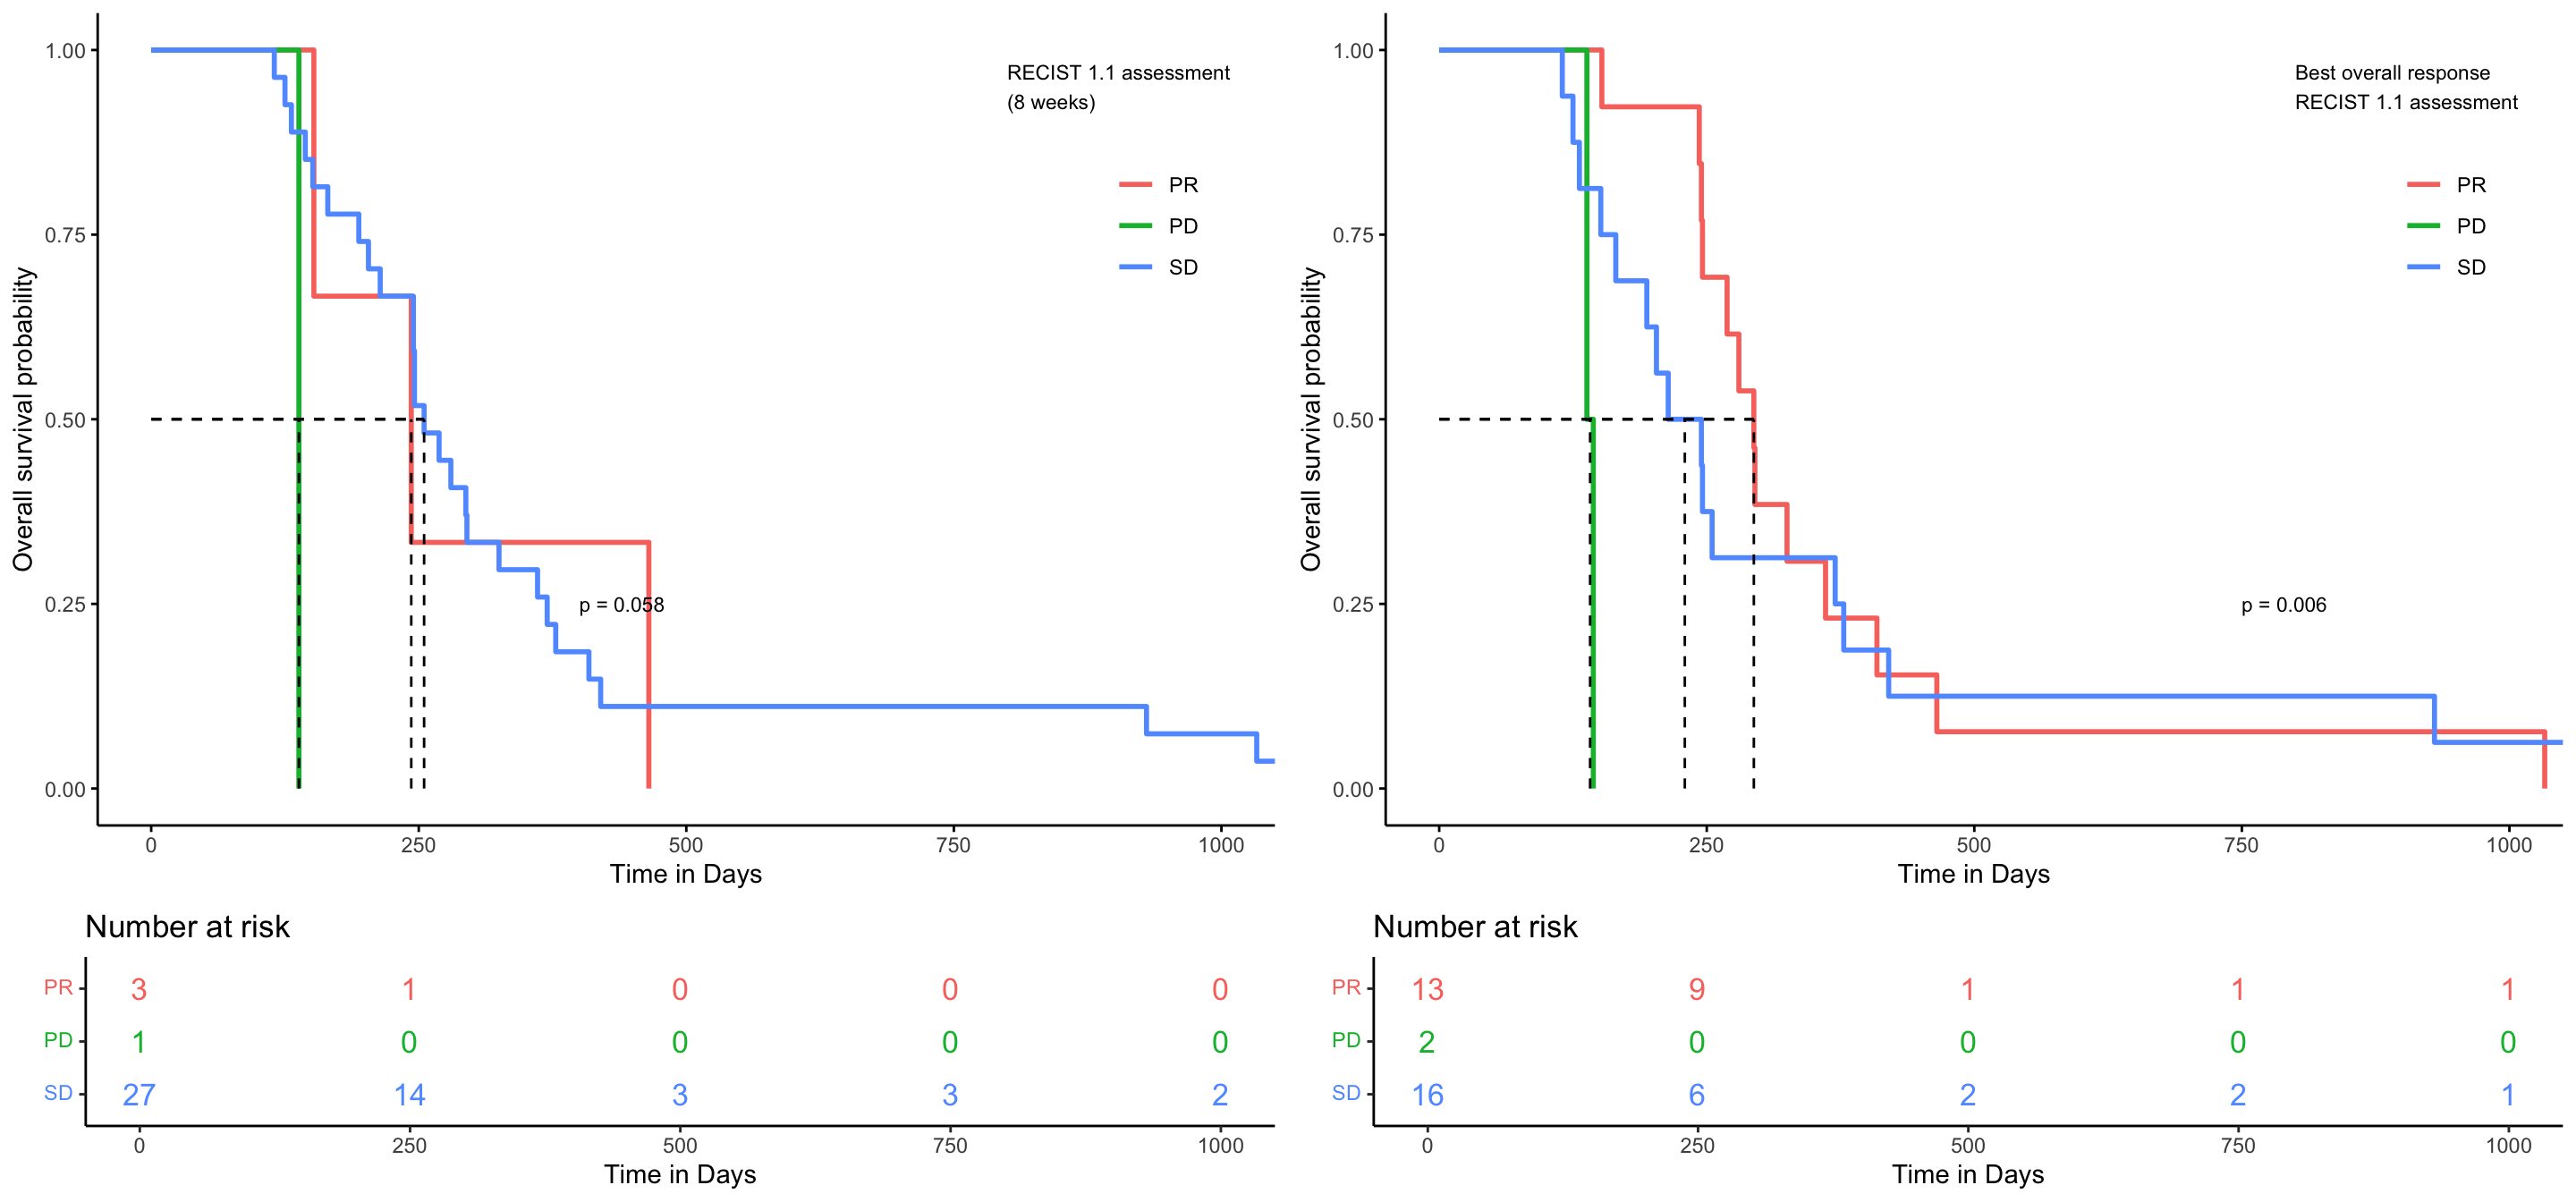
coxFU1 <- coxph(Surv(`OS (days)`, Deceased) ~ FU1, data = DELFI_complete)
summary(coxFU1)
Call:
coxph(formula = Surv(`OS (days)`, Deceased) ~ FU1, data = DELFI_complete)
n= 31, number of events= 31
coef exp(coef) se(coef) z Pr(>|z|)
FU1Progressive Disease 2.19189 8.95213 1.27898 1.714 0.0866 .
FU1Stable Disease -0.06534 0.93675 0.61883 -0.106 0.9159
---
Signif. codes: 0 '***' 0.001 '**' 0.01 '*' 0.05 '.' 0.1 ' ' 1
exp(coef) exp(-coef) lower .95 upper .95
FU1Progressive Disease 8.9521 0.1117 0.7299 109.80
FU1Stable Disease 0.9367 1.0675 0.2785 3.15
Concordance= 0.531 (se = 0.041 )
Likelihood ratio test= 2.49 on 2 df, p=0.3
Wald test = 3.81 on 2 df, p=0.1
Score (logrank) test = 5.7 on 2 df, p=0.06coxBOR <- coxph(Surv(`OS (days)`, Deceased) ~ BOR, data = DELFI_complete)
summary(coxBOR)Call:
coxph(formula = Surv(`OS (days)`, Deceased) ~ BOR, data = DELFI_complete)
n= 31, number of events= 31
coef exp(coef) se(coef) z Pr(>|z|)
BORProgressive Disease 2.4553 11.6501 0.9455 2.597 0.00941 **
BORStable Disease 0.2208 1.2471 0.3831 0.576 0.56432
---
Signif. codes: 0 '***' 0.001 '**' 0.01 '*' 0.05 '.' 0.1 ' ' 1
exp(coef) exp(-coef) lower .95 upper .95
BORProgressive Disease 11.650 0.08584 1.8259 74.332
BORStable Disease 1.247 0.80185 0.5886 2.642
Concordance= 0.623 (se = 0.051 )
Likelihood ratio test= 5.16 on 2 df, p=0.08
Wald test = 6.74 on 2 df, p=0.03
Score (logrank) test = 10.22 on 2 df, p=0.006
sessionInfo()R version 4.4.1 (2024-06-14)
Platform: aarch64-apple-darwin20
Running under: macOS 15.3.1
Matrix products: default
BLAS: /Library/Frameworks/R.framework/Versions/4.4-arm64/Resources/lib/libRblas.0.dylib
LAPACK: /Library/Frameworks/R.framework/Versions/4.4-arm64/Resources/lib/libRlapack.dylib; LAPACK version 3.12.0
locale:
[1] en_US.UTF-8/en_US.UTF-8/en_US.UTF-8/C/en_US.UTF-8/en_US.UTF-8
time zone: America/New_York
tzcode source: internal
attached base packages:
[1] stats graphics grDevices utils datasets methods base
other attached packages:
[1] lubridate_1.9.4 forcats_1.0.0 stringr_1.5.1 dplyr_1.1.4
[5] purrr_1.0.4 readr_2.1.5 tidyr_1.3.1 tibble_3.2.1
[9] tidyverse_2.0.0 survminer_0.5.0 survival_3.8-3 readxl_1.4.5
[13] here_1.0.1 ggpubr_0.6.0 ggplot2_3.5.1 workflowr_1.7.1
loaded via a namespace (and not attached):
[1] tidyselect_1.2.1 farver_2.1.2 fastmap_1.2.0 promises_1.3.2
[5] digest_0.6.37 timechange_0.3.0 lifecycle_1.0.4 processx_3.8.6
[9] magrittr_2.0.3 compiler_4.4.1 rlang_1.1.5 sass_0.4.9
[13] tools_4.4.1 yaml_2.3.10 data.table_1.17.0 knitr_1.49
[17] ggsignif_0.6.4 labeling_0.4.3 xml2_1.3.7 abind_1.4-8
[21] withr_3.0.2 grid_4.4.1 git2r_0.35.0 xtable_1.8-4
[25] colorspace_2.1-1 scales_1.3.0 cli_3.6.4 rmarkdown_2.29
[29] generics_0.1.3 rstudioapi_0.17.1 km.ci_0.5-6 httr_1.4.7
[33] tzdb_0.4.0 commonmark_1.9.2 cachem_1.1.0 splines_4.4.1
[37] cellranger_1.1.0 survMisc_0.5.6 vctrs_0.6.5 Matrix_1.7-3
[41] jsonlite_1.9.1 carData_3.0-5 car_3.1-3 callr_3.7.6
[45] hms_1.1.3 rstatix_0.7.2 Formula_1.2-5 jquerylib_0.1.4
[49] rematch_2.0.0 glue_1.8.0 ps_1.9.0 ggtext_0.1.2
[53] stringi_1.8.4 gtable_0.3.6 later_1.4.1 munsell_0.5.1
[57] pillar_1.10.1 htmltools_0.5.8.1 R6_2.6.1 KMsurv_0.1-5
[61] rprojroot_2.0.4 evaluate_1.0.3 lattice_0.22-6 markdown_1.13
[65] backports_1.5.0 gridtext_0.1.5 broom_1.0.7 httpuv_1.6.15
[69] bslib_0.9.0 Rcpp_1.0.14 gridExtra_2.3 whisker_0.4.1
[73] xfun_0.51 fs_1.6.5 zoo_1.8-13 getPass_0.2-4
[77] pkgconfig_2.0.3